About
Real time coastal wind, wave, and water level guidance is presented here for the East Central Florida Coast with high resolution in the Indian River Lagoon and Brevard County. These predictions were made by the physics-based ADCIRC+SWAN numerical model using NOAA’s North American Mesoscale (NAM) model or the latest forecast/advisory from the National Hurricane Center (NHC). You can also have access to an operational, ensemble-based, probabilistic wind setup forecasting for the Indian River Lagoon via probabilistic real-time forecasts of coastal estuarine setup.
This guidance is for use by official decision makers and does not represent an official forecast. All private citizens are advised to seek information from their local National Weather Service Weather Forecast Office or local Emergency Manager.
 source National Hurricane Center (NHC)
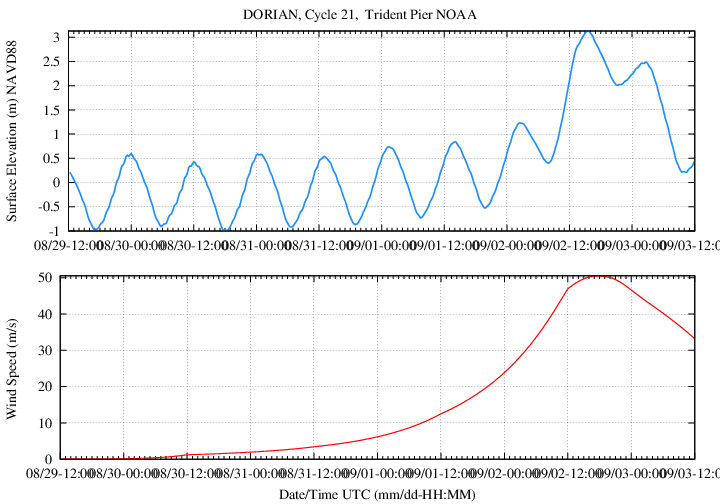
Tropical Cyclone (Atlantic Basin): Storm ‘DORIAN’
Real time hydrographs and wind speed plots at Melbourne, Virgina Key, Lansing Island in South Banana River, and Sebastian are also available.
Predicted water Levels (m NAVD88), and overlaid wind (m/s) in Atlantic Basin
Trident Pier: Hydrograph (m NAVD88) (Top) / Wind Speed (m/s) (Bottom)
Small-amplitude, high-frequency oscillations in water level are associated with numerical instability. We are currently working on solving this issue
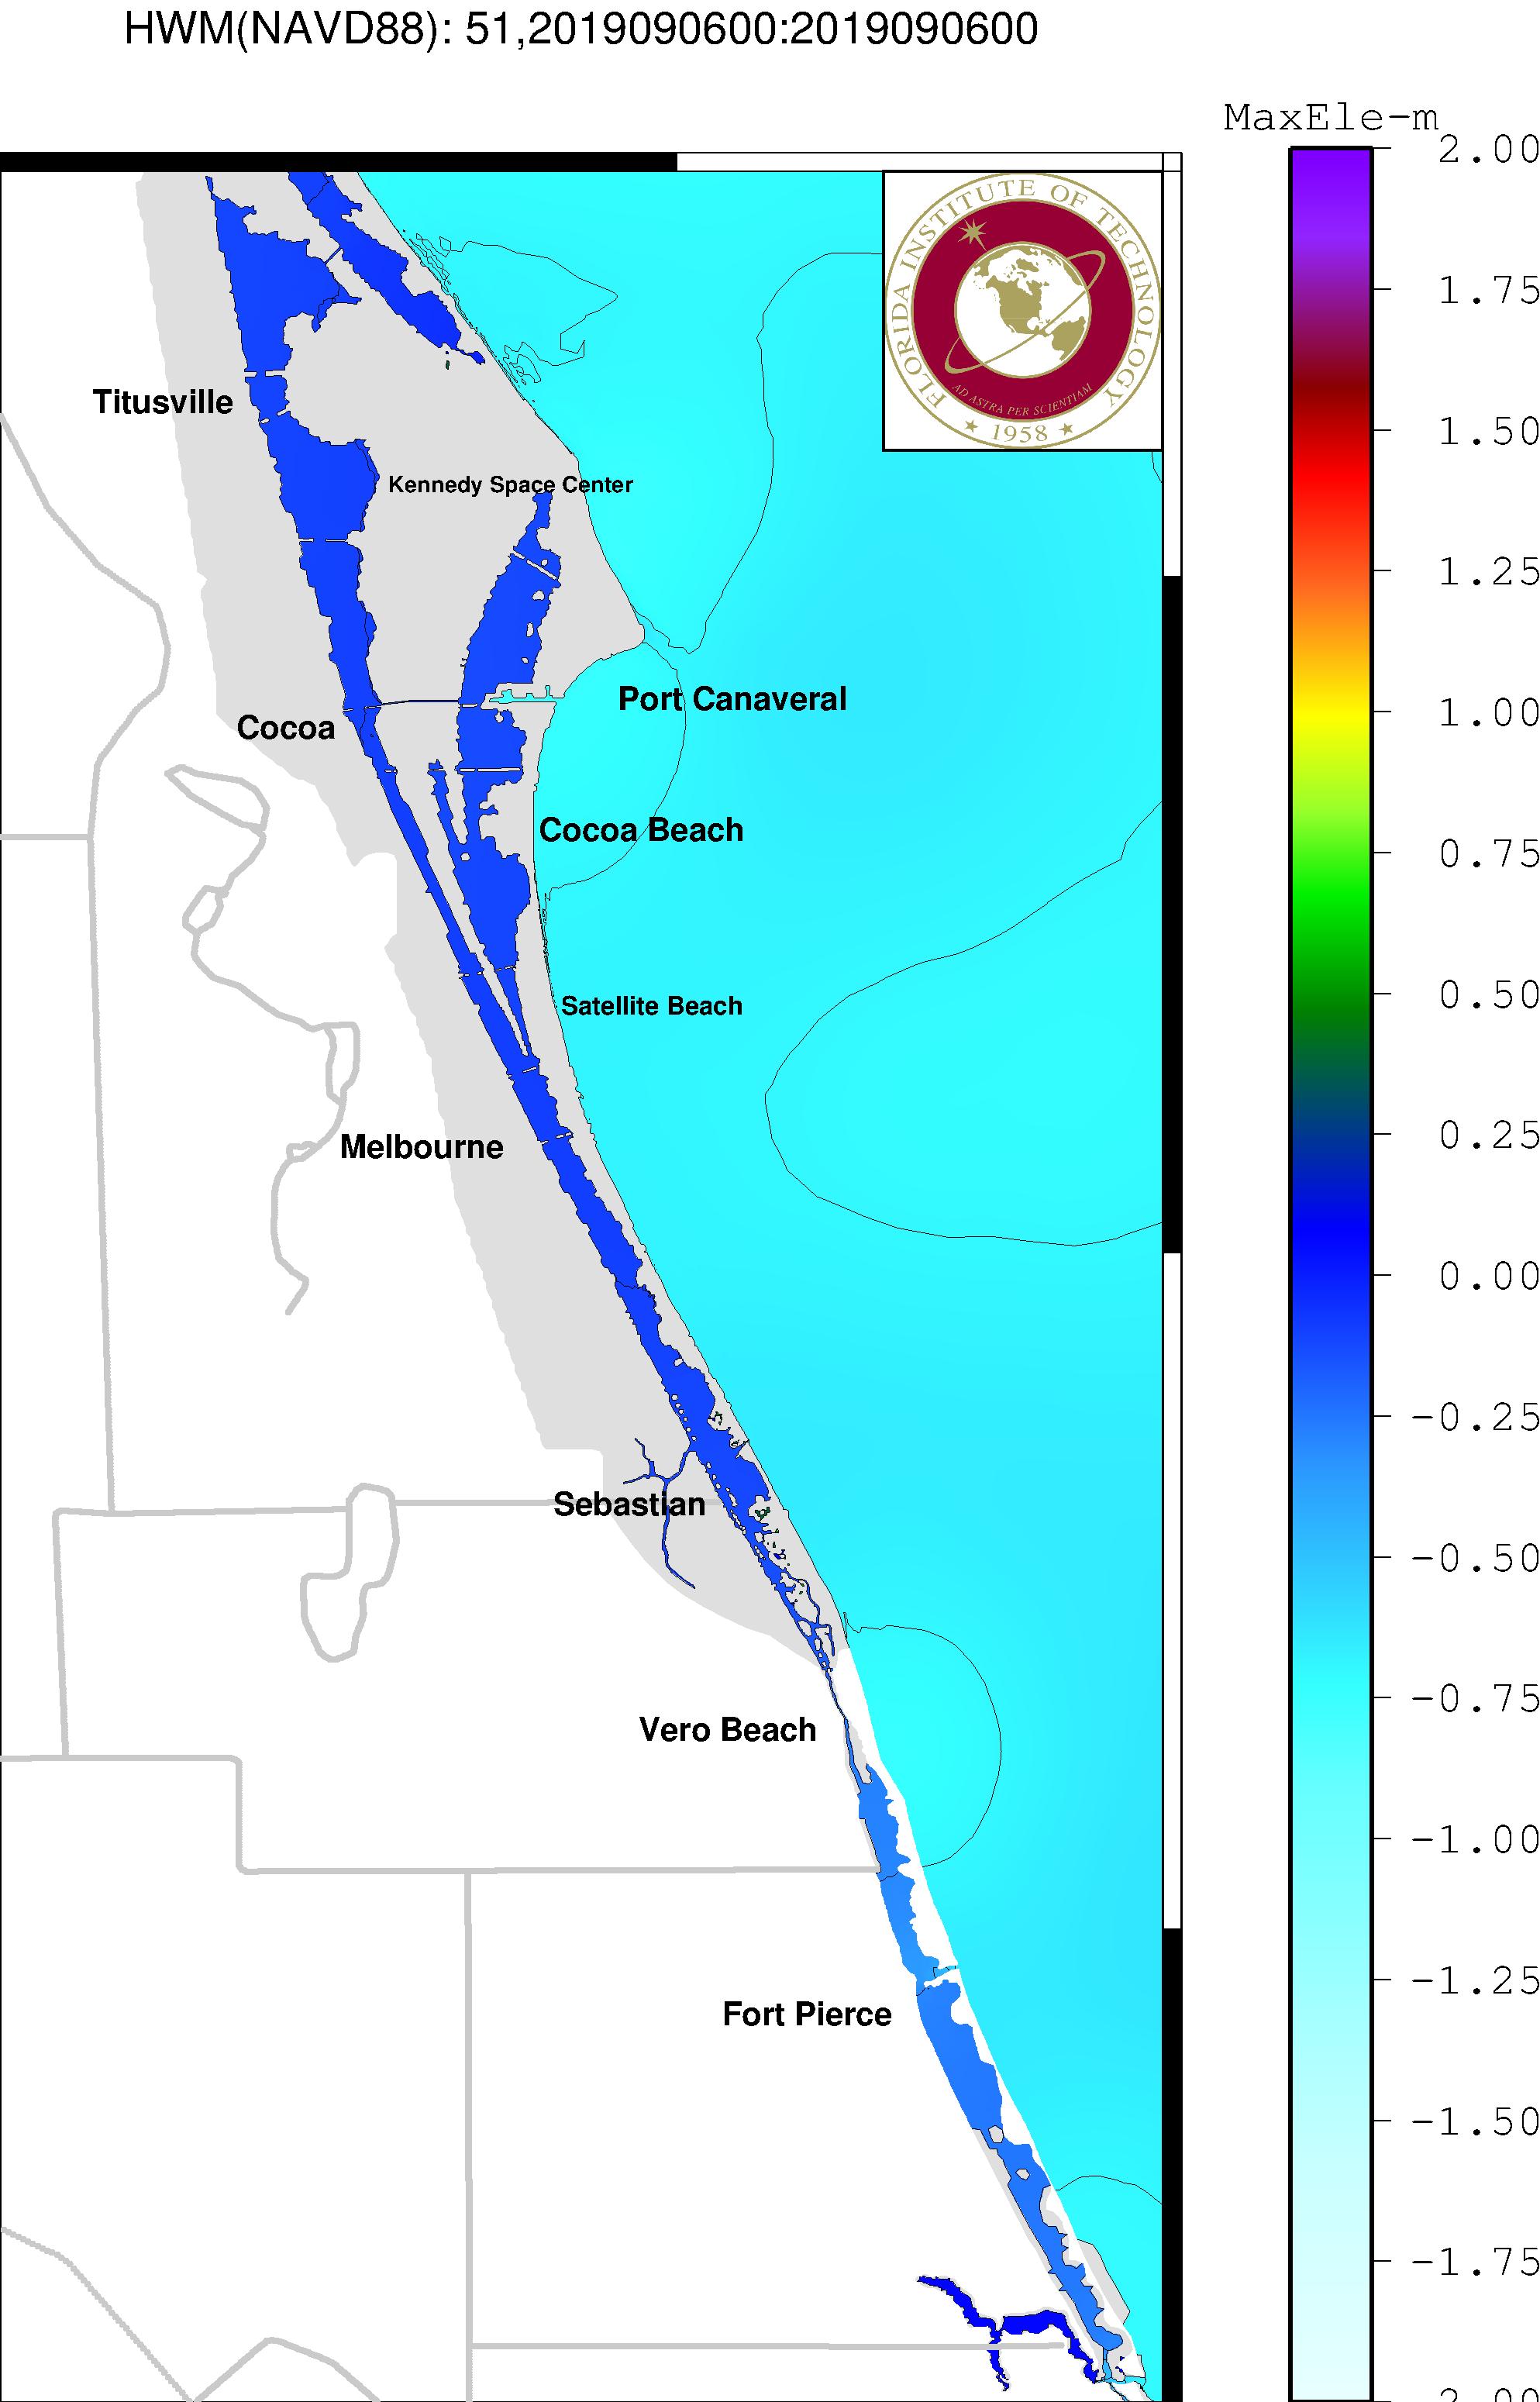
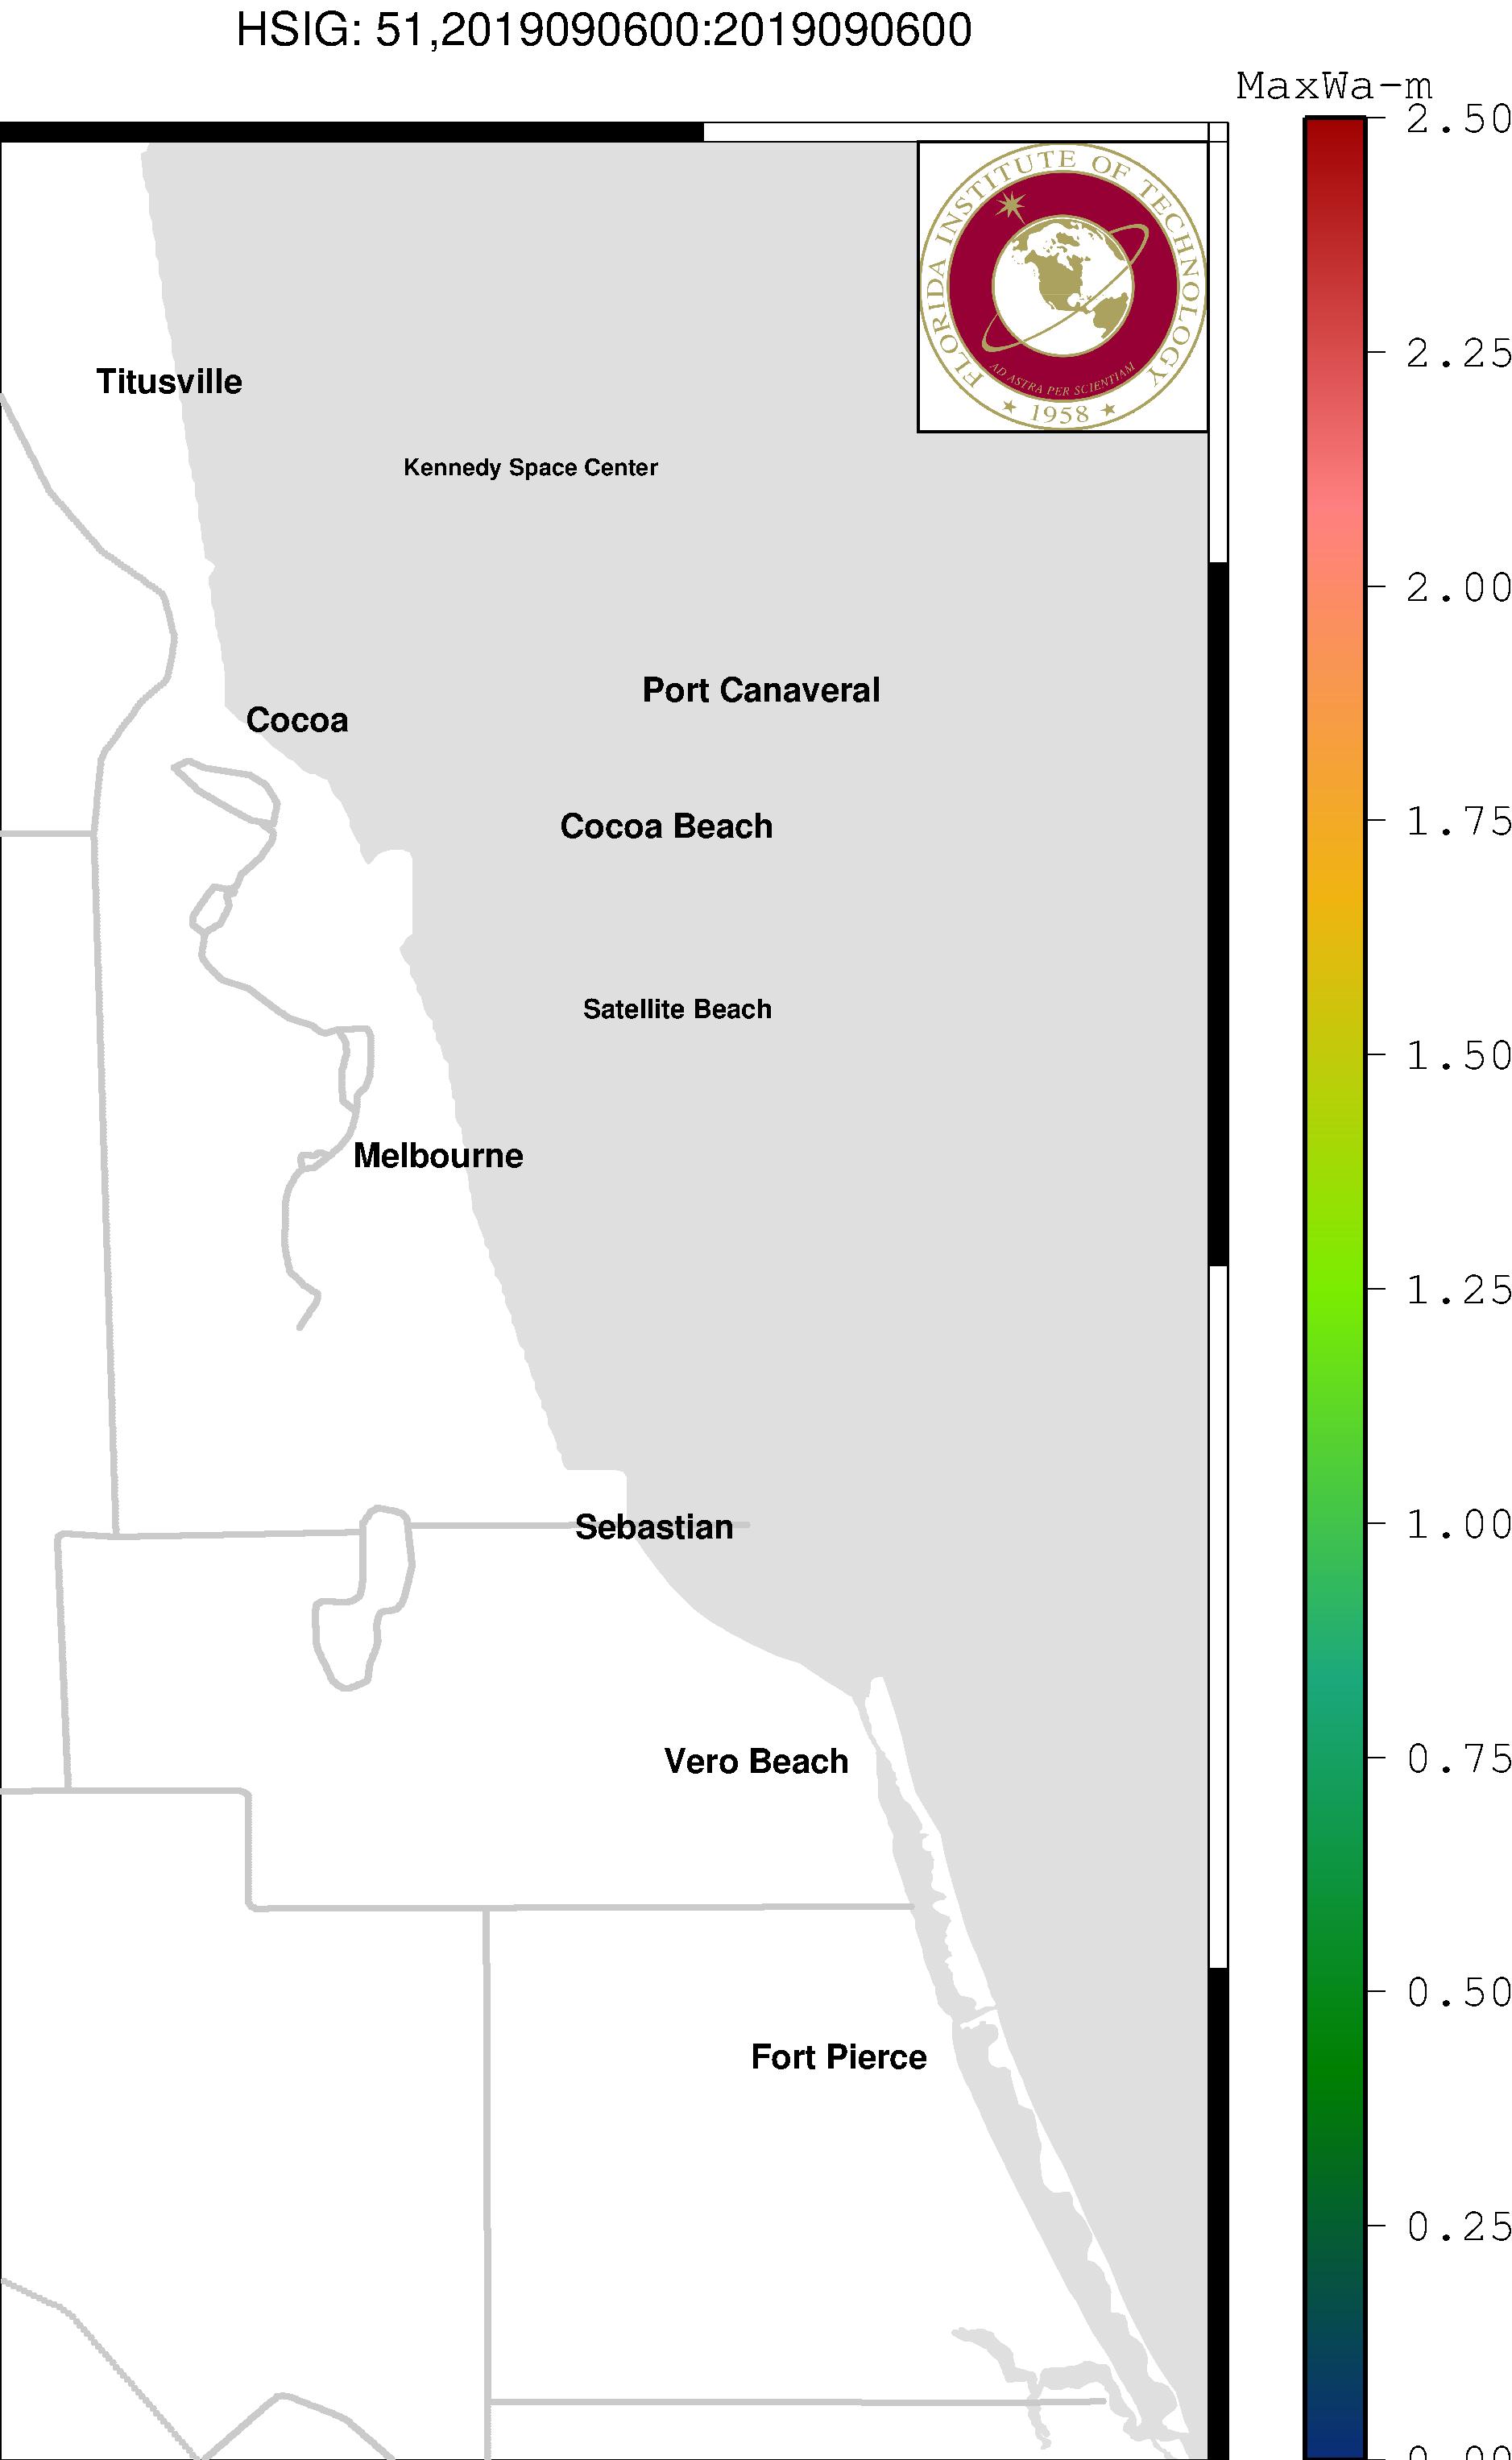 Left: Peak Water Levels (m NAVD88) / Right: Max Significant Wave Height (m)
Real time hydrographs and wind speed plots at Melbourne, Virgina Key, Lansing Island in South Banana River, and Sebastian are also available.
Guidance Based on NAM Model
Three and a half days forecast results
Real time hydrographs and wind speed plots at Melbourne, Virgina Key, Lansing Island in South Banana River, and Sebastian are also available.
Predicted water Levels (m NAVD88), and overlaid wind (m/s) in Atlantic Basin

Trident Pier: Hydrograph (m NAVD88) (Top) / Wind Speed (m/s) (Bottom)
Small-amplitude, high-frequency oscillations in water level are associated with numerical instability. We are currently working on solving this issue

 Left: Maximum Surface Elevation (m) Right: Maximum Wave Height (m)
Real time hydrographs and wind speed plots at Melbourne, Virgina Key, Lansing Island in South Banana River, and Sebastian are also available.
Models
ADCIRC
The ADvanced CIRCulation (ADCIRC) model [8, 9] is a system of computer programs commonly used by the Federal Emergency Management Agency (FEMA), the U.S. Army Corps of Engineers (USACE), academic research groups, and local agencies. The system computes sea surface elevations, currents, and wind generated waves due to mesoscale processes such as tides and hurricane storm surge.
SWAN
To predict wave characteristics, Simulating Waves Nearshore (SWAN), is tightly coupled with ADCIRC (ADCIRC + SWAN) [4, 3, 2]. SWAN is a third generation, phase-averaged wave model that employs finite difference method [1, 6].
Models Coupling
In ADCIRC+SWAN, the ADCIRC model passes water level, current velocities, wind velocities, and friction roughness lengths to the SWAN model. SWAN then computes water depth, wave propagation, depth-induced breaking, and other wave processes. These wave characteristics are passed back to ADCIRC where the radiation stress gradients are evaluated at each vertex and used to compute the water level and current velocity at the next time step [4, 3, 2].This data passing back-and-forth represents true two-way coupling, producing guidance that takes into account the relevant coastal physics.
ADCIRC Surge Guidance System
The SWAN+ADCIRC coupled model is normally run manually, one run at a time. As a result, in order to make this real time guidance available around the clock, the ADCIRC Surge Guidance System was used to efficiently and reliably automate the process of downloading the latest meteorological data, creating input files, running ADCIRC+SWAN, and post processing the output. The ASGS is open source software with many Official users and contributors, including the US Army Corps of Engineers (USACE), the National Hurricane Center (NHC), and the US Coast Guard (USCG) [5]. More information is available at the ASGS GitHub site.
Visualization
FigureGen is a FORTRAN program that acts as an interface between the SWAN+ADCIRC simulation files and the resulting illustrations. FigureGen is incorporated within the ASGS, and it is used to visualize forecast guidance. The visualization cores read the SWAN+ADCIRC files, convert the data into appropriate formats, and then call the GMT tools to generate contours, vectors, etc. Command-driven interactive plotting program; gnuplot, is also used to plot times series results at specific locations. click here for references.
Computational Resource
| Meteorological force | Computer |
|---|---|
| North America Meso-scale (NAM) model | Pelican with 24 nodes |
| Tropical Cyclone | Coconut with 48 nodes |
Contributors
Peyman Taeb, PhD Candidate
Robert J Weaver, PhD
This project is operated and maintained by FL-ASGS, contact us email
![]()
![]()
.